Everyone knows the best way to show off data and statistics is in the form of a nifty chart. And now you can take advantage of a tool built right into Squarespace to do just that!


The Squarespace Chart Blocks tool enables you to show off your data in a super effective and beautiful way. Available in line, bar, and pie graph options, these charts are fully responsive, so they will always scale to size on any device. Featuring customizable color palettes, the Squarespace Chart Blocks allow you to present information in an easy-to-read graphic format. Simply copy and paste from a .csv file or add the data one cell at a time in the editor.


Need a hand adding charts to your Squarespace site? Give us a ring at 1.516.900.3498, or e-mail josh@fix8media.com.


Check out the three styles below:


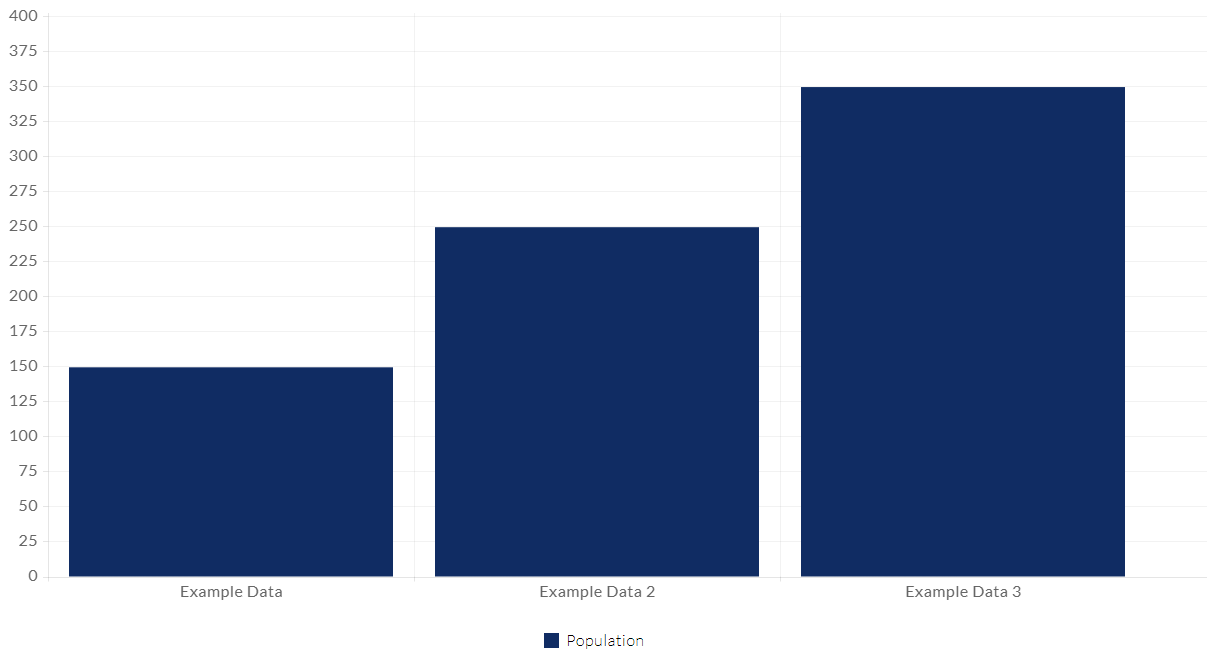
This is an example bar chart

Bar graph comparing data for three categories, with the third bar being tallest.

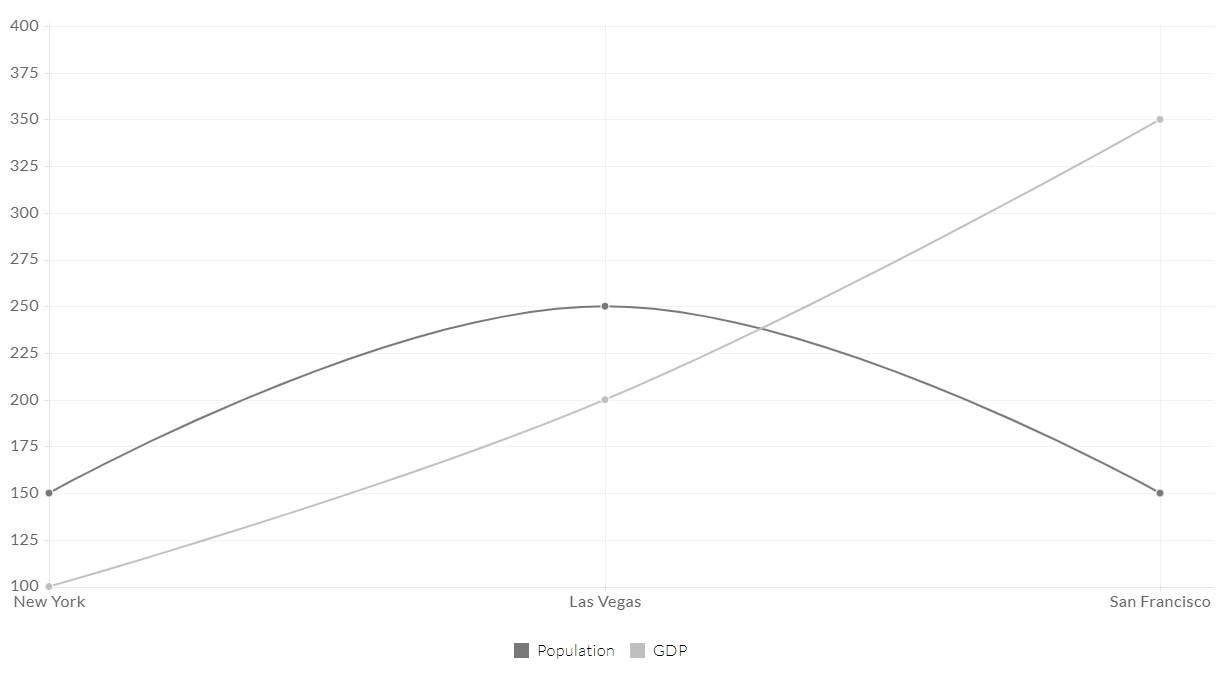
This is an example line chart

Line graph shows data labeled

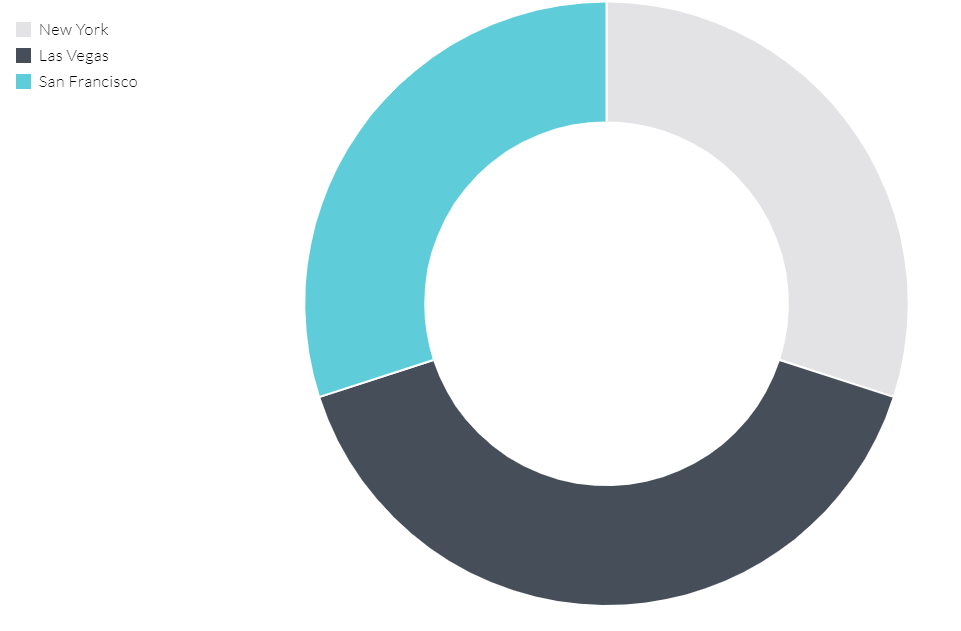
This is an example pie chart

Donut chart showing the breakdown of data for New York (white), Las Vegas (dark grey), and San Francisco (light blue).
Mockup of a website design displayed across a computer monitor, laptop, tablet, and smartphone on a gray background.
By Eoin McCourt April 2, 2026
See how Fix8 Media refreshed a New Jersey home builder's website with modern design and SEO strategy. Custom Duda build that generates quality leads.
By Eoin McCourt March 11, 2026
See how Fix8 Media redesigned a major consumer food brand website. Modern design that drives brand engagement and online sales.
VA-accredited attorney's website displayed on desktop, laptop, tablet, and phone, featuring a silhouette of veterans.
By Eoin McCourt February 24, 2026
See how Fix8 Media designed a website for a veteran-led law firm. Professional layout that builds trust and drives client inquiries.
Show More